KmperTrace: Observability Toolkit for Cross-Platform Debugging
Why developers need KmperTrace
If you’ve ever stared at hundreds of log lines trying to answer one simple question, “what actually happened?”, you already understand the problem KmperTrace solves. Modern client applications spread work across async boundaries, SDK callbacks, background jobs, and platform-specific code, so the failure often appears far away from the cause. KmperTrace turns that scattered output back into a readable execution flow.
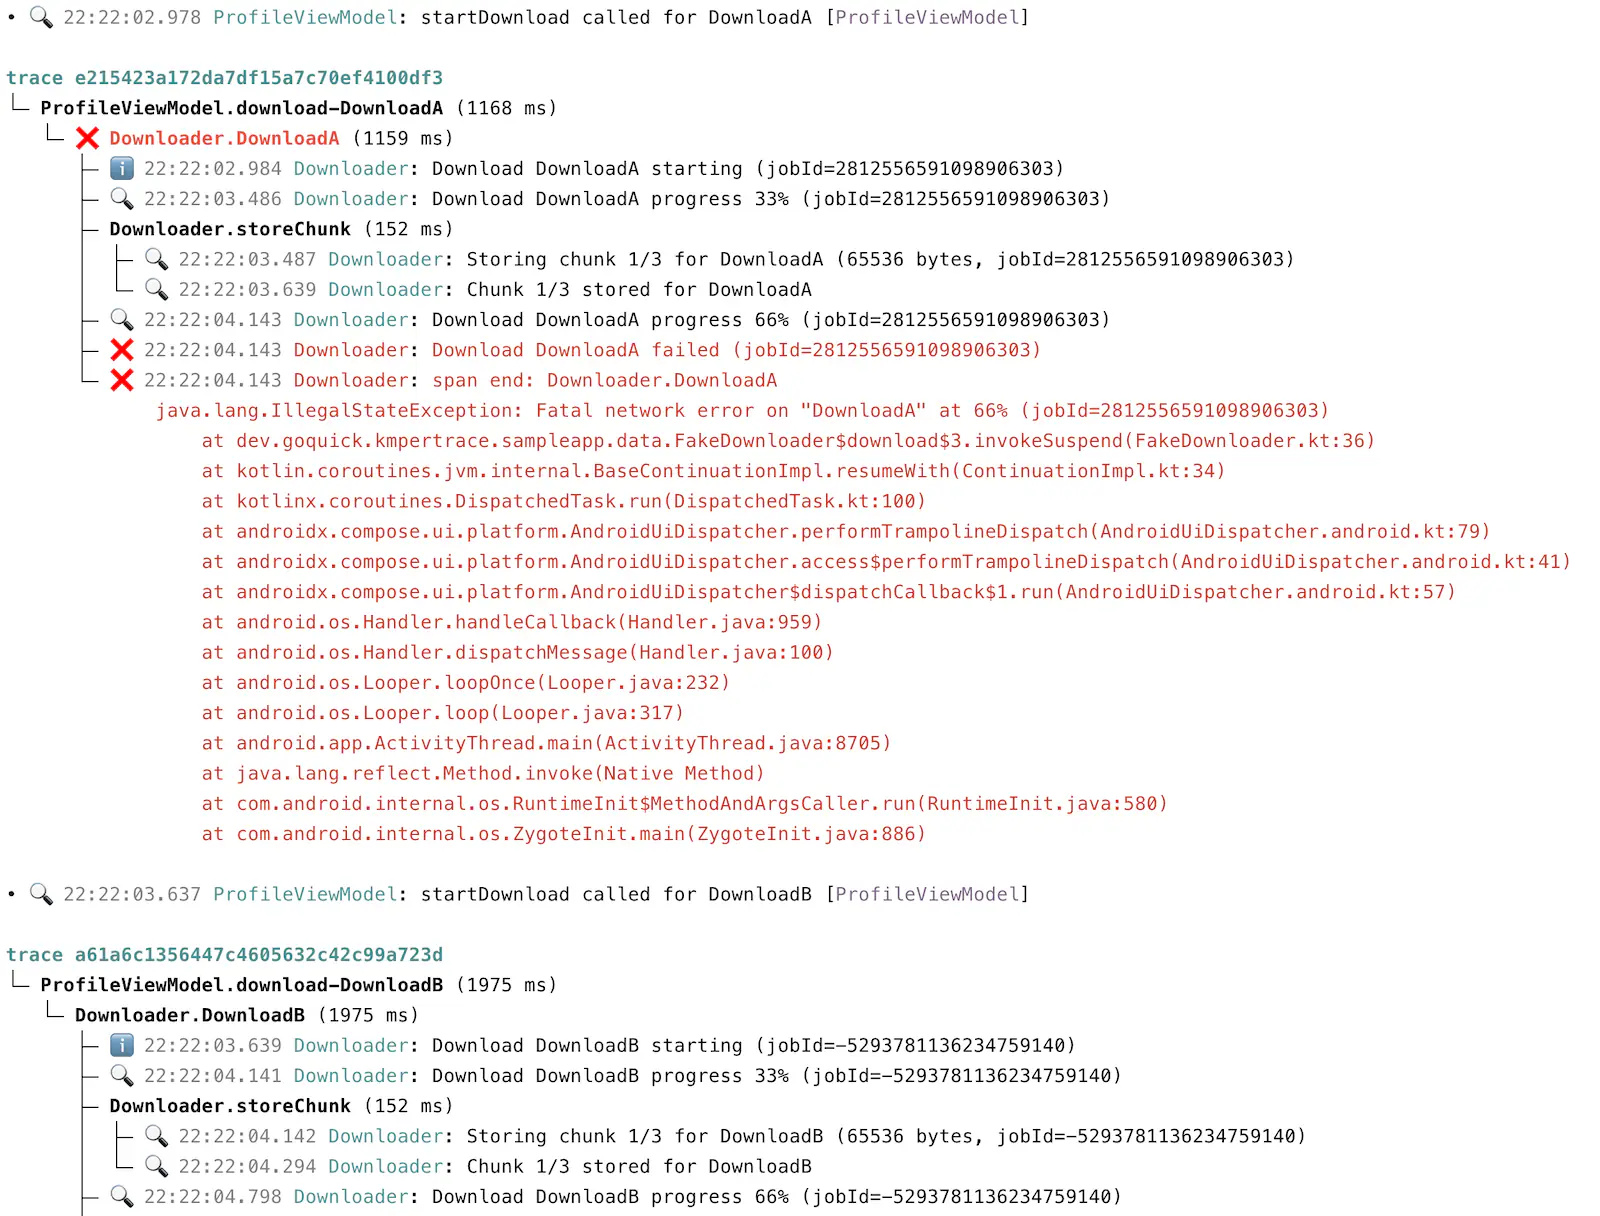 kmpertrace-cli output: Two overlapping downloads, nested repository/DB calls, and an injected failure - all reconstructed from plain log output.
Why we created KmperTrace
Before PluralFusion, members of our team spent years shipping more than 18 smartwatch products, swapping chipsets, changing vendors, and keeping companion apps working across constant hardware and SDK churn. When things broke, the logs were there but understanding them was difficult if not impossible. We had to reconstruct what happened by reading lines out of order, correlating by timestamp, guessing at causality. There was no simple way to answer the most fundamental questions about what caused the connectivity or data synchronization issue. As we started to build a mobile app for PluralFusion HealthMesh, we knew we needed better tooling. So we built it.
What KmperTrace IS
KmperTrace is a lightweight tracing and structured-logging toolkit for client runtimes. It encodes span structure, IDs, timing, and context directly into plain log lines so async execution flows can be reconstructed later.
Today, KmperTrace is focused primarily on client-side applications across Android, iOS/Swift, Desktop, and Wasm, so it is broader than mobile while still centered on runtime debugging.
What KmperTrace IS NOT
KmperTrace is not a collector, backend, or server-side service you need to deploy before it becomes useful. It is not trying to replace OpenTelemetry, Jaeger, or a full production observability stack for dashboards, alerting, and long-term telemetry storage. That boundary matters because KmperTrace is designed to reconstruct client-side execution flows (with first-class async execution support) from plain logs you already collect, not to operate a centralized observability system.
How KmperTrace works
KmperTrace has two parts:
-
kmpertrace-runtime is the library you add to your application; it wraps work in spans and writes trace metadata such as span IDs, parent-child relationships, timing, and context directly into structured log lines. And your logs are still human-readable, even if you decide not to use KmperTrace.
-
kmpertrace-cli is the companion CLI. It can read KmperTrace logs from a saved file or stream them live from real devices, then reconstruct readable trace trees with nesting, durations, errors, and context. Because the trace structure lives in the logs themselves, you can use KmperTrace with your existing log pipeline and without deploying a collector or backend first.
KmperTrace works across Android, iOS/Swift, Desktop, and Wasm, and keeps trace context attached across coroutine and thread hops. Internally, the library is built with Kotlin Multiplatform, but teams use it through normal platform-specific artifacts, such as a standard Android dependency or an iOS XCFramework. In practice, that means you do not need Kotlin Multiplatform expertise to adopt KmperTrace or use it as part of an existing Android or Swift codebase.
For async boundaries such as SDK callbacks, handlers, executors, and platform event loops, KmperTrace provides trace snapshot functionality to carry trace context forward. Instead of a thousand unrelated log lines, you get a readable story with nesting, timing, and the exact failing step.
In KMP (or Android) it might look like this:
traceSpan(component = "DeviceSync", operation = "refreshLatestReadings") {
    Log.i { "starting device refresh" }
    val snap = captureTraceSnapshot()
    sdk.fetchLatestReadings { result ->
        snap.withTraceSnapshot {
            result
                .onSuccess { readings ->
                    Log.i { "received ${readings.size} readings from device" }
                }
                .onFailure { error ->
                    Log.e(throwable = error) { "device fetch failed" }
                }
        }
    }
}
Raw logs become a readable flow tree:
  trace 8f3c1423
  └─ ❌ DeviceSync.refreshLatestReadings (412 ms)
     ├─ ℹ️ 12:00:01.120 DeviceSync: starting device refresh
     └─ ❌ 12:00:01.532 DeviceSync: device fetch failed
         DeviceTimeoutException: Timed out waiting for 7F:2A:91 after 3000 ms
            at vendor.sdk.BleSession.awaitResponse(BleSession.kt:184)
            at vendor.sdk.ReadingsClient.fetchLatestReadings(ReadingsClient.kt:92)
            at example.DeviceSync.refreshLatestReadings(DeviceSync.kt:57)
            at example.DeviceSync$refreshLatestReadings$1.invoke(DeviceSync.kt:41)
            at ...
Instead of scanning raw lines, you get structured trace trees. From saved logs, KmperTrace reconstructs the full call flow after the fact; in the interactive terminal UI, concurrent traces stay separated and grow as new events arrive, so you can watch overlapping async work unfold in real time and immediately see timing, nesting, and the failing step.
The core use case: development and QA. When you’re building async flows across SDK boundaries and something breaks, KmperTrace shows you what actually happened. That’s the problem it was designed for.
Platform Support
Teams do not have to use KMP to use KmperTrace. Today it works across these platforms:
- Android/Kotlin
- iOS/Swift
- Desktop (JVM)
- WASM
When to Use KmperTrace
KmperTrace is built for any native client runtime where async execution crosses boundaries and context gets lost. The pattern applies across mobile, desktop, IoT, Wasm, and Windows native code alike:
Desktop and mobile applications - enough said
IoT companion apps and wearable clients. When a firmware update stalls or a device sync drops, the bug is almost always in the handoff between a device SDK callback and the application’s own logic.
WASM runtimes. As business logic moves to the browser or edge via Wasm, the same async tracing problems appear in new environments. KmperTrace’s WASM support means execution flows are traceable.
KmperTrace Benefits
Traceability from plain logs
KmperTrace does not require a collector, agent, or observability backend to be useful. It encodes span lifecycle and IDs directly into structured log lines, so you can use your existing log pipeline. That means you can start small: add spans, collect logs, and reconstruct full flow trees later.
One debugging language across platforms
Different platform teams usually drift into different logging styles over time. KmperTrace gives shared conventions for span names, component/operation metadata, and trace IDs, so debugging discussions are less ambiguous.
Faster root-cause analysis
Instead of scanning raw logs line by line, the CLI groups records by trace and rebuilds call trees. You see parent/child relationships, timing, and error stacks in one place. This shortens the path from “something failed” to “this span failed for this reason after this sequence.”
Better “user journey” visibility
Sometimes the most important question is: “what kicked this off?”
We have Journey support in API, you can start traces from explicit triggers like taps or system events, so traces read like product flows:
tap.refresh => push.open => system.network_change
and everything that follows becomes a coherent tree.
No infrastructure commitment to start
Add the runtime, collect logs, reconstruct traces. If you need it, grow into a fuller observability setup when you’re ready.
Repository
Code, libraries, and the CLI installer: https://github.com/PluralFusion/kmpertrace
KmperTrace is OpenSource
KmperTrace is open source and actively developed by the PluralFusion team. We built it to solve a real problem in our own work, and we think it’s useful enough to share with the broader developer community.
If you’re working through similar async tracing challenges, we’d love to have you try it. Issues, feedback, and contributions are welcome on GitHub.